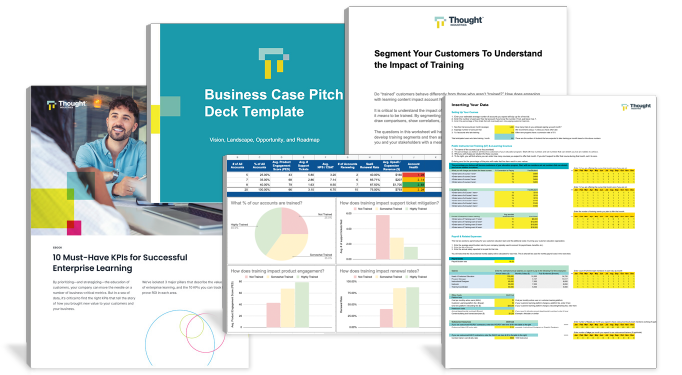
Take the guesswork out of proving ROI and securing buy-in from stakeholders with these templates & tools.
You don’t need to settle for low investment in enterprise learning.
The reality for many customer learning programs, as you well know, is the need to run a great program with limited resources and a lean team. If you can relate to this, you’re probably familiar with:
A lack of bandwidth to take advantage of big opportunities for your business
Feeling major strain to continuously keep up with your product, or
A hardworking team that’s constantly underpowered compared to the work to be done.
But, there’s another side of what’s possible in enterprise learning. In our research at Thought Industries, we found that the teams who were delivering the most business impact were also the most well funded. Their reality looked like this:
A fully-staffed core team, including instructional designers, training specialists, and analysts,
A versatile technology stack that underpinned high productivity, and
Ease of access to other cross-functional teams, including marketing support and development resources.
Download Full ROI Toolkit
Get the full suite of Thought Industries ROI Toolkit files in one free download. Click below for a ZIP file containing all the templates and resources.
Then, continue reading below to dive into the 5 key steps for driving impact and investment with program ROI.
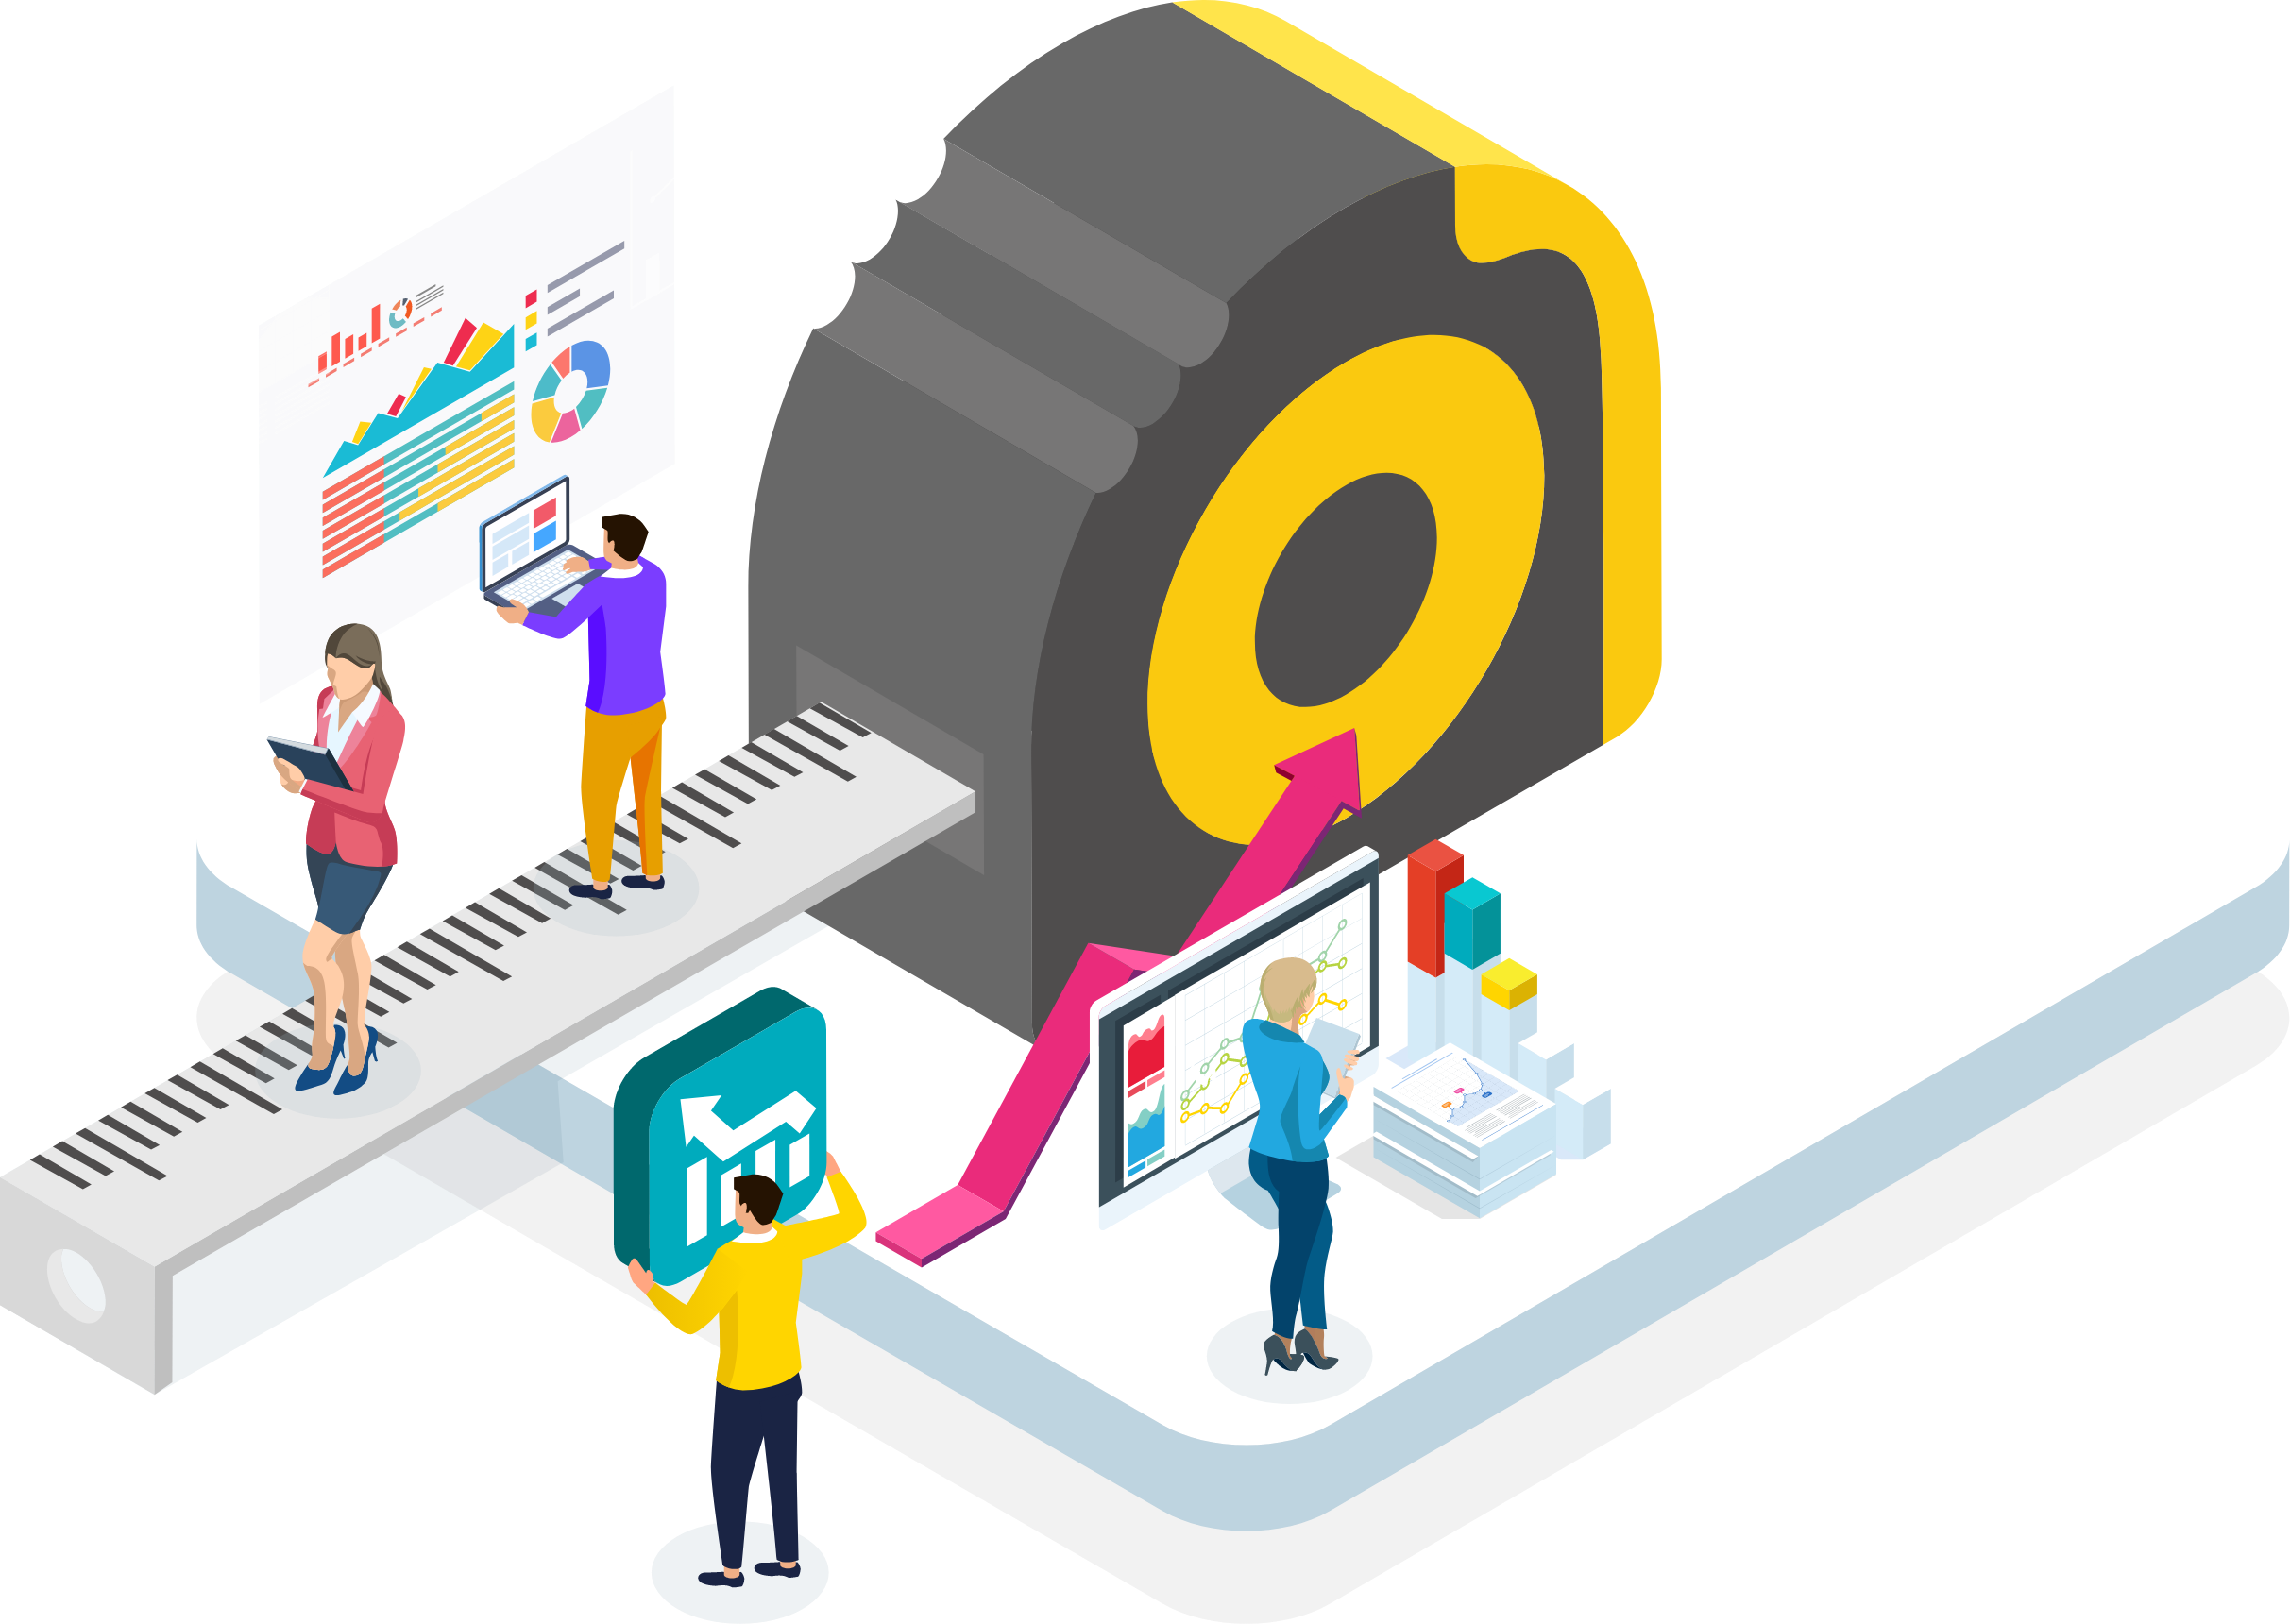
At the core of high investment is a performance dashboard.
In our research into how learning teams advance their performance, we found a consistent marker of the highest-performing teams: They all use dashboards to prove their impact and build the case for getting the resources they need to grow.
A successful dashboard should show both learning outcomes and business outcomes, and the influence from one to the other.
This kind of data visualization helps you tell a clear, compelling story to your stakeholders, unlocking resources and buy-in.
A great dashboard:
Builds credibility and the right to ask for investment from the executive team.
Demonstrates value and mediating collaboration with peer functions.
Focuses the learning team on what’s most important, and give credit for success.
Your first step is to choose business impact metrics that are relevant across your organization and that align with executive priorities and strategic focus. In other words, understand the big picture of what your program impacts – or could impact – and build a measurement strategy around it in a way that will resonate with your biggest stakeholders.
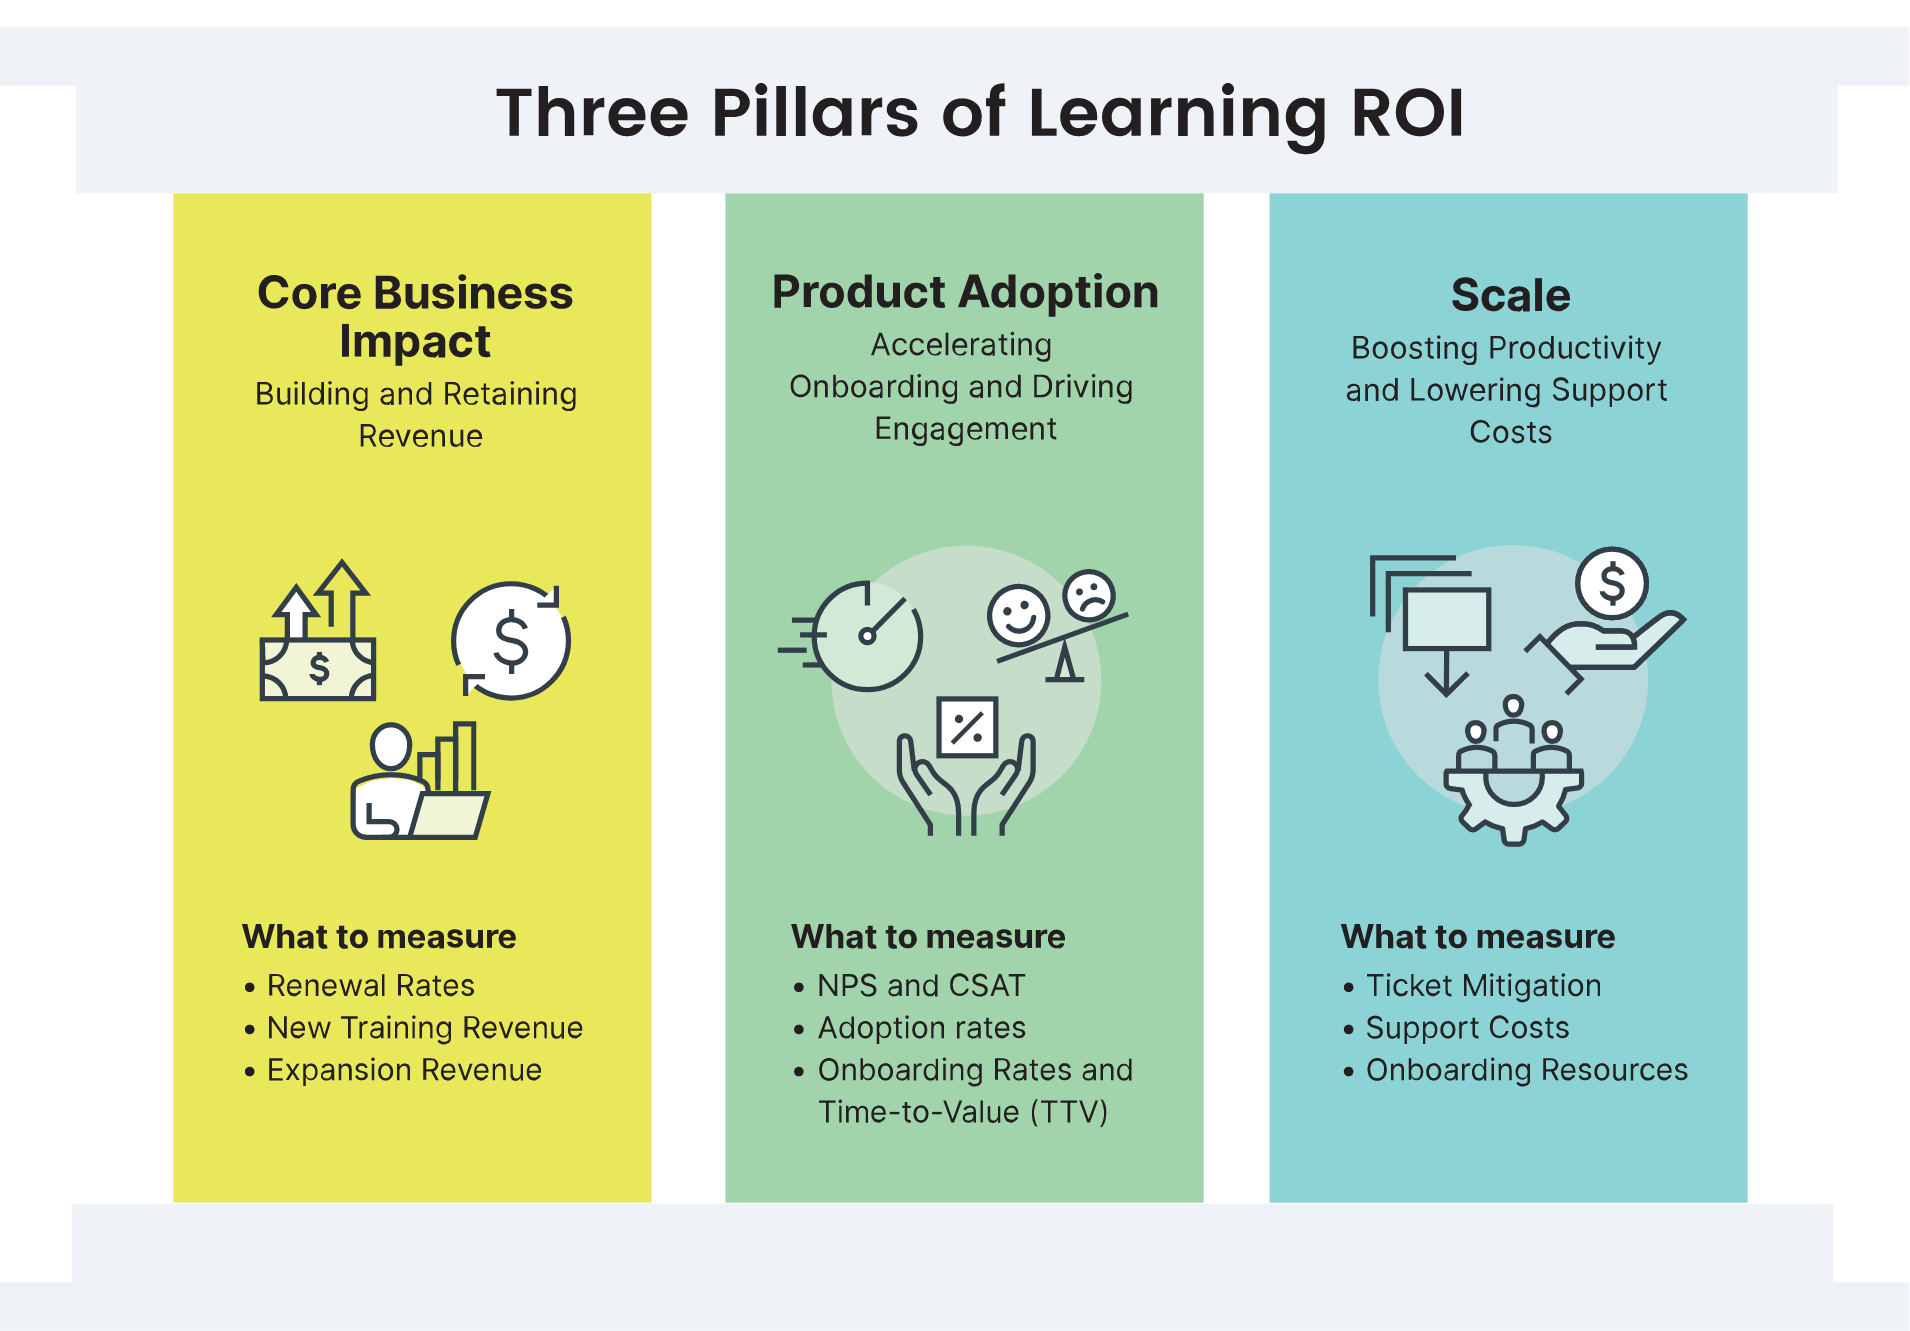
Is your business focused on building brand awareness, perhaps even creating a new category? Are they wanting to improve onboarding new customers and reducing time to value? Is the focus on sustained product adoption? Below, you’ll find several common business outcomes for learning programs according to Thought Industries’ three pillars of ROI.
Read through this list to brainstorm the top 1, 2, or 3 business impact outcomes to target at your organization. And, check out our guide to measuring the ROI of enterprise learning for more guidance.
Choose Your KPIs and Source Your Data
Second, organize your information so that you can choose realistic, measurable, and shared KPIs. Learning’s impact on these metrics will ultimately be what you present to key stakeholders, so it’s critical to choose a focused set of KPIs that tell a clear, impactful story. You’ll need to consider both what will show the biggest effect from training as well as what’s most important to your particular organization.
To get started, gather a network of collaborators and cross-functional peers when it comes to the business impact data you pinpointed in Step 1. What is currently being tracked at your organization, and where? Is your data connected and centralized through a data warehouse? Does your learning platform have integrations with Salesforce, Zendesk, and other systems across the business? Considering these questions will save you from choosing a metric that turns out to be impossible to accurately measure given the constraints of your business.
Use the diagram below to brainstorm which collaborators – and which data sets – to audit.
Find Your Data Partners
Want to know more about calculating KPIs?
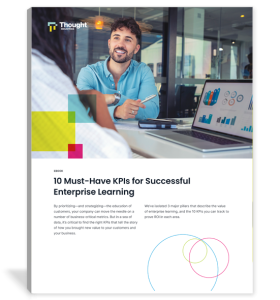
We’ve isolated the top 10 KPIs you can track to prove ROI in customer learning, plus the best methods to collaborate with other teams and calculate your results. Download our free eBook on the 10 Must-Have KPIs for Successful Enterprise Learning.
Establish a Learning Score to
Differentiate Trained & Untrained
Third, now that you’ve chosen one or more realistic and measurable KPIs that align to the outcomes you hope to achieve, you need to answer the question: How should we segment our customers in order to measure outcomes accurately?
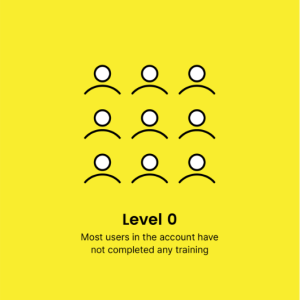
You might define different customer groups according to who you consider “trained,” “engaged,” or another category that aligns with your business offering. But it’s beneficial to dig deeper and make these definitions highly specific and relevant to your business. For example, does a “trained” account indicate the depth of training courses consumed, the number of users consuming content, or a mixture of both? Segmenting these customer groups can help you see trends and analytics more clearly according to the adoption of your learning program.
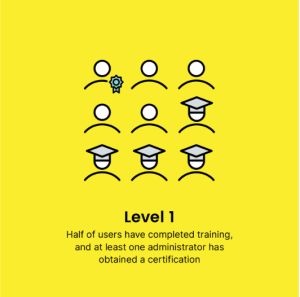
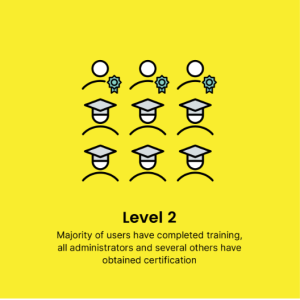
Check out these examples of some common ways programs establish a learning score:
Defining a Learning Score
Need more guidance to build a segmented customer framework?
Download this free worksheet and answer key questions about your customer makeup, key milestones in learning, and minimum standards you may already be tracking.
Analyze and Visualize the Data
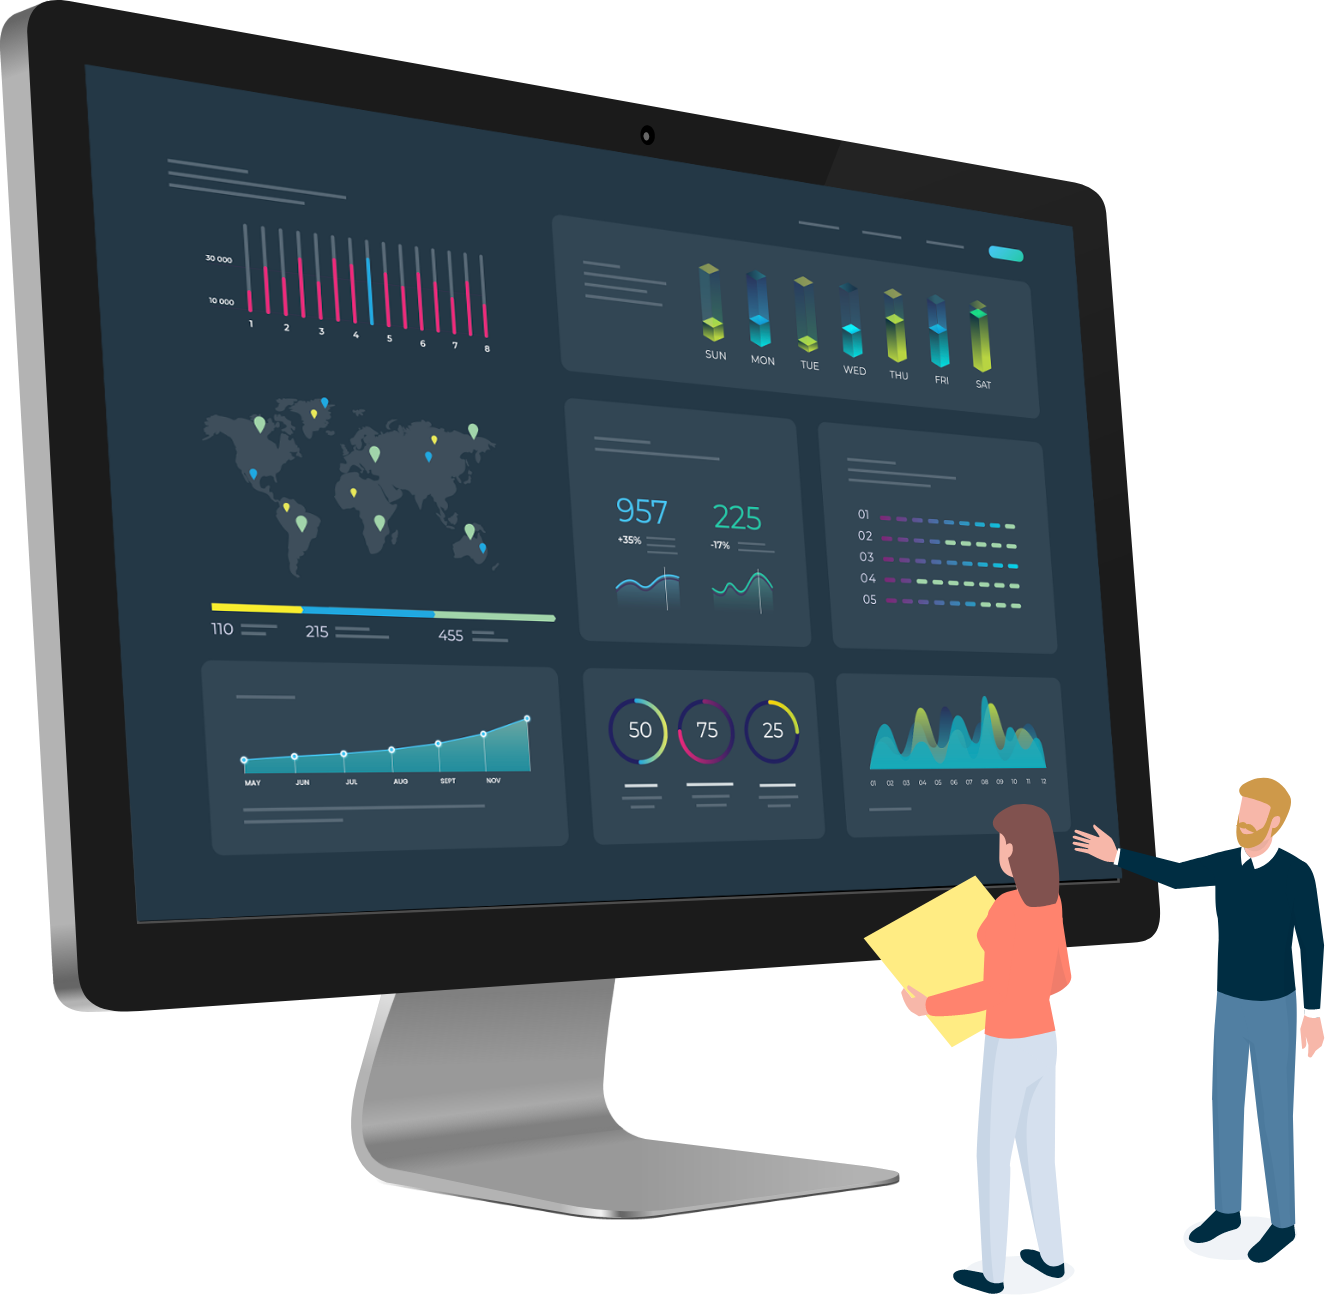
Fourth, it’s time to bring together the data you’ve collected in the previous steps. You have your KPIs, the strategic outcomes you want to achieve, and you’ve defined your cohorts to sort tiers of impact – now, analyze your results and visualize them in a shareable dashboard. For many small (but mighty) teams, deep data integration through a data warehouse may not be available. While this makes data visualization a more manual and tedious process, it IS possible.
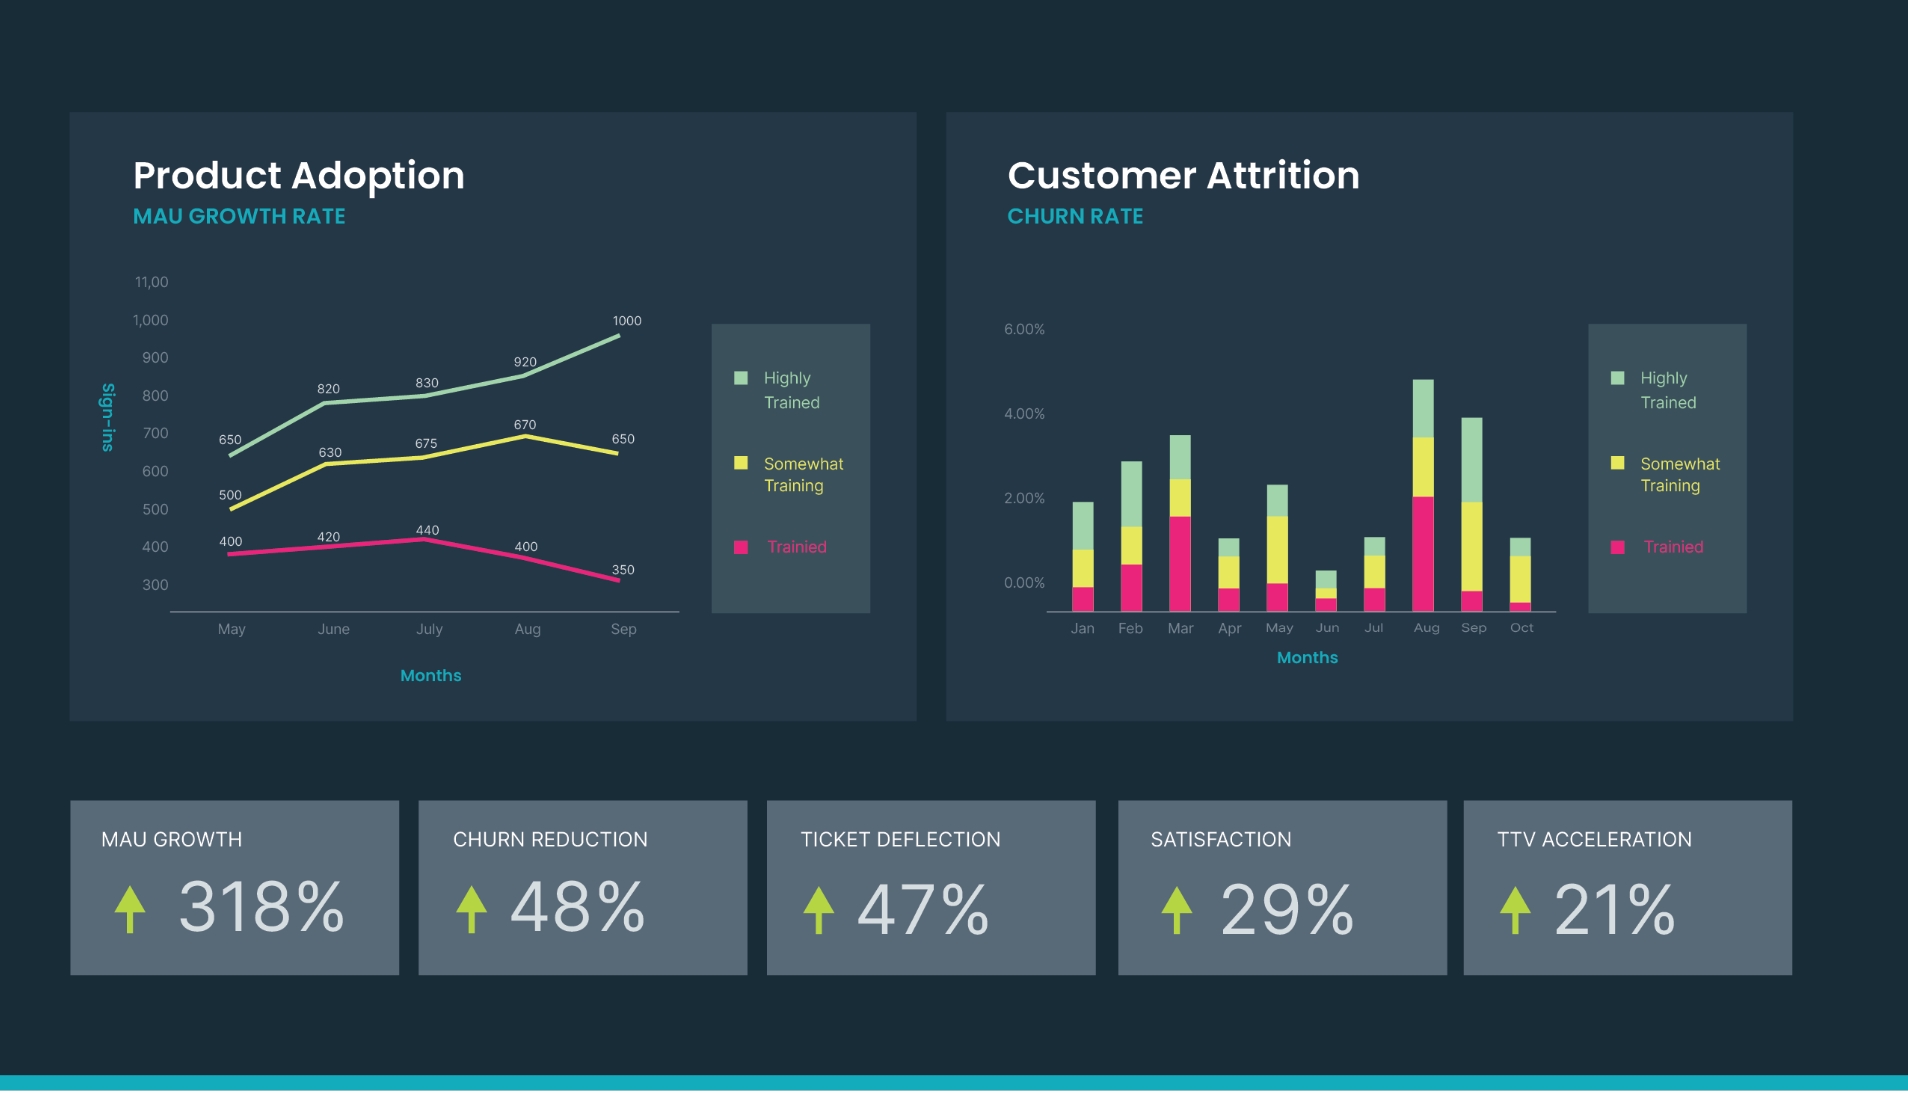
Whether it’s created through a back-of-napkin process or with sophisticated technology, a dashboard is powerful because it succinctly communicates the true impact of your program through visual means. At its best, a dashboard is easy to understand, engaging, and tells a clear story. This is just as achievable in a google sheet as it is with an automated tool.
When you put in the work to assemble a successful dashboard, you might be left with something like the image below, which tells a clear story: the “not trained” segment contributes the least to net expansion, whereas “somewhat trained” contributes more, and the “highly trained” customers contribute the most.
Not sure where to start to build your dashboard?
Use our free tool to input the metrics you’ve collected and see your results come to life!
Advocating in 360 Degrees
Ultimately, while getting to a point of building your dashboard is a huge win, you won’t get the full benefit from it unless you can now advocate and prove the worth of your program according to those results. This fifth and final step isn’t just about making the business case – the highest-performing learning leaders found that they used the same impact dashboard for multiple objectives across the business.
Two factors will impact the way you communicate your program results to others: the resources you’re asking for, and the group (or individual) you’re contacting. First, make sure you have a clear ask in mind. You may be in desperate need of more team bandwidth, for example, but key stakeholders will need more details to know what you’re looking to achieve.
To help brainstorm your request, browse this list:
Additional full-time staff for the learning team
Defined & dedicated support from internal teams on a particular project
New learning technology, platforms, or tools
Increased contractor hours or new contract hires
Scoped and secured expertise from internal subject matter experts
Internal advocacy, participation, and buy-in from multiple team leads
Looking for a boost to your business case? Try our ROI Calculator, which projects the return on investment your company could realize by implementing Thought Industries technology.
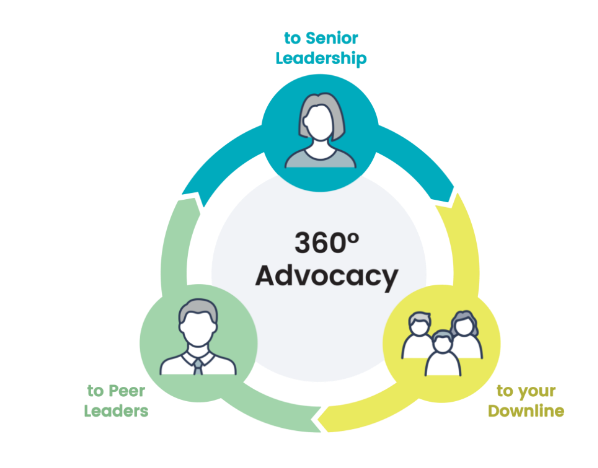
Then, make a plan to articulate your impact – and specific requests – to the most critical stakeholders for the conversation. Use this chart to learn how to tailor your messaging to different groups across the business.
to Senior Leadership
Focus on the big-picture takeaways they care about most
Use the 1-2-3 rule: one overall point, two metrics or slides, and three minutes for the whole pitch
Prewire each stakeholder individually ahead of group decision meetings to give context
to Peer Leaders
Show them potential meaningful win-wins and benefits for their own teams
Invite their feedback (especially on process metrics)
Provide access to additional details and materials if they’re interested
to Your Downline
Build a ritual around updating the dashboard
Humanize the numbers with specific acknowledgements
Craft a storyline around the data that encourages and uplifts the team’s efforts
Want to jumpstart your business case presentation?
Use our free business case presentation deck template. Make a copy and simply edit it using your own impact metrics and company details.
Download Full ROI Toolkit
Get the full suite of Thought Industries ROI Toolkit files in one free download. Click below for a ZIP file containing all the templates and resources.
Want more expert advice?
Learn more about how Thought Industries’ learning technology and best-in-class strategic partnership. Schedule a demo today.
We’re always learning and exploring new research questions. To join our cohort, or get a personalized maturity consultation, email us at [email protected].